

Calculating insert stats from BAM files
by Ketil Malde; September 11, 2012
Given a set of reads, the first step of analysis is almost always to align them to a reference. Today, this means running some specialized aligner - I generally use bwa - which results in a BAM file. The next step is (or should be) to check the result, and I wrote a small tool for this purpose.
Basic operation
A pair of reads is classified in one of four classes. First, “innies” have the reads pointing inwards, i.e. the mate of a read is found downstream and on the reverse-complement strand. This is the normal orientation for paired-end reads. “Outies” point outwards, this is the result of mate-pair protocols that circularize and clip the insert before sequencing. Finally, “lefties” are oriented the same way with the first read upstream of the second, and “righties” point the same way, but with the second read upstream.
We support calculating statistics on the distribution of insert lengths (bam stats), a histogram (bam hist), or quantiles (bam quant). It is also possibly to simply dump the contents of the BAM file in SAM format - sorted by orientation of the pairs (bam dump), this is mostly for debugging purposes..
Examples
It is probably just as easy to document this by example, so here goes:
Distribution stats
% dist/build/bam/bam stats 0207.bam
Alignment                count     prop    mean   stdev    skew    kurt
innies                  161010  46.00%  37351.9  4099.5     0.1     0.1
outies                       0   0.00%      NaN     NaN     NaN     NaN
lefties                      6   0.00%  28524.8 27577.8     0.2    -1.9
righties                     0   0.00%      NaN     NaN     NaN     NaN
Total reads:    700106
Here we see that most of the mapped reads are “innies”, with a mean insert length of 37K (it’s a fosmid library, so this is as expected), and a very nice normal distribution as seen from the skew and kurtosis columns.
Quantiles
The mean can be deceptive when dealing with skewed distributions, and often it is more useful to use median - and by extension, quantiles.
% bam quants tmp/inbred-110415_8-mp2.bam
Alignment                count    prop       5%     25%     50%     75%     95%
innies                 4491570   9.38%      200     281     393    1696    4289
outies                17652491  36.86%      530    1206    1843    2549    3627
lefties                  30334   0.06%      699    5355   16625   51108  332782
righties                 33161   0.07%      721    5431   17111   47540  339773
Total reads:    95771572
The data is from a mate-pair sequencing protocol, but fairly typically, it isn’t very reliable, and it gives a pretty high proportion of regular paired-end reads. It also maps relatively few pairs.
Histogram
% bam hist -b 5 -n 1e6 100910_s_3_GLW-1.bam
Alignment                count    prop      200     400     600     800     >
innies                  396093  79.22%    14229  324953   55744     984     183
outies                   22839   4.57%      146     262     331     775   21325
lefties                    891   0.18%       85     152     121     107     426
righties                   879   0.18%       49     131     113     117     469
Total reads:    1000000
This is ostensibly a mate-pair library, but as we can see, it’s mostly regular paired end reads with lenghts between 200 and 400bp.
Note that we used -n to limit the number of reads (for expediency), and -b to limit the number of buckets (for clarity of presentation).
Histogram plots
Histograms are good candidates for plotting, and there’s a --plot option that generates output suitable for piping into gnuplot. This option takes an optional string argument which is passed to gnuplot, so you can use it to inject gnuplot commands (e.g. to plot only innies, do --plot='set xrange [0:]; set yrange [0:]'. Or to output to a file, do --plot='set out "file.jpg"; set term png'.) Output can be piped to gnuplot --persist, or redirected to a file.
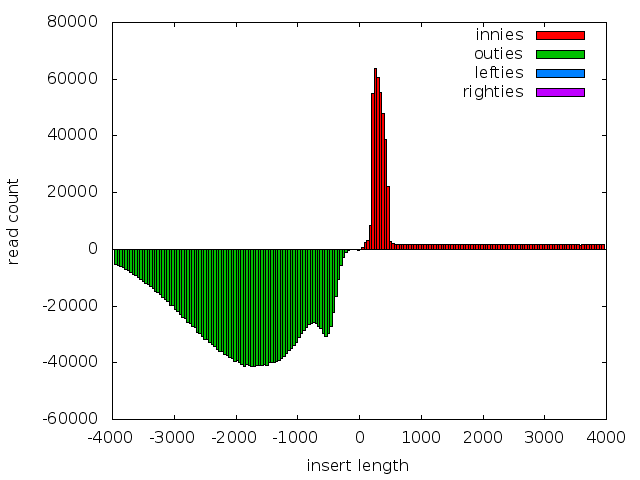
An example plot for the mate-pair sequences. Note a large fraction of ‘innies’ remain, and that the distribution of ‘outies’ looks to be bimodal.
Performance
Parsing through a large BAM file takes a few minutes, over five on my PC for 200M reads (14Gb of compressed data). You can use the -n option to limit the number of reads processed, this usually gives you a good approximation quickly.
Notes on implementation
Since we’re dealing with potentially large files, everything is calculated by streaming through the data. This way, the memory footprint is low.
For distribution statistics, I’m using the standard trick from SAS’s UniVar method. We first calculate (simultaneously) the number of data points, their sum of x, sum of squares, sum of cubes, and sum of fourths, and at the end, we derive the various measures.
Histograms are of course trivial, using a set of buckets, we just fill them up as we go along.
Quantiles are a bit tricky, there’s a review on WP of how this can be done, but most methods either require storing the data, require multiple passes, or are complicated and slow. In the end, I settled for an approximate variant, based on the histogram code. We use a set of buckets (this time with slightly increasing sizes), and identify the correct bucket for each quantile. We then interpolate to get the quantile value.
Interestingly, I accidentally forgot to limit the number of buckets generated. To my surprise (and then embarrassement at being surprised), it worked nicely. Laziness, of course, allows an infinite sequence of buckets, and as long as you don’t look for quantiles above 100%, this will work.
Availability
As usual, bamstats is on hackage, or you can get a copy with darcs get http://malde.org/~ketil/biohaskell/bamstats (or just browse the source archive). I’ve also mirrored the repository on hub.darcs.net, at the moment this is an experiment, but if it works out well, this could be the new official home.
Let me know if you find the program useful!
comments powered by Disqus